White Paper: Laser Light Engine Output Stability
Introduction
The growing demands on spectral, spatial and temporal performance from the imaging hardware designed to support increasingly complex biological data collection, in state-of-the-art microscopy applications, are weighty. Light quality and consistency is critical to the sensitivity, discrimination, resolution, and the realized image quality. Sophisticated users are exploiting spectral complexity through the use of fluorophores that emit in ultraviolet, visible or near infrared wavelengths. The number and diversity of fluorescence probes keeps growing. Biological specimens are visualized via a broad array of sample formats including thick tissue sections on traditional microscope slides, microtitre plates with thousands of wells, microarrays of genomic materials with hundreds of thousands of spots, and a diverse range of custom “chips” which can contain fluidic channels or electrochemical sensors, to name a few. While widefield fluorescence microscopy techniques have long been implemented with fluorphore families, hardware developments are still required to overcome the physical constraints inherent to such sample complexity. Optically pooled screening and single molecule localization microscopy (MERFISH) are techniques designed to exploit label diversity for so-called spatial biology applications. Structured illumination microscopy (SIM) and spinning-disk confocal microscopy are pushing the physical boundaries of subcellular resolution and sample penetration depth. Yet the lasers utilized to engage in such complex microscopy represent their own challenges. Selecting a set of lasers from the variety of source technologies, controlling their modal behavior, taming short and long term stability, and managing alignment on a configurable optical table presents a non-trivial challenge and can be distracting from the biologists’ primary focus. To facilitate such hardware mastery, Lumencor offers the CELESTA Light Engine.
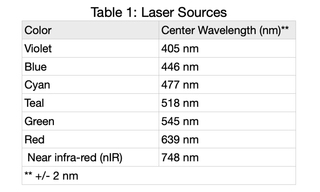
Lumencor’s CELESTA Light Engine (CELESTA) consists of seven individually addressable solid-state lasers (Table 1) from a larger group of available laser sources. The CELESTA can house up to seven lasers, each delivering ~800 mW at the output end of a downstream optical fiber. One of the most operationally important features of the CELESTA is that the light output characteristics of all seven lasers are consistent in spatial and temporal respects; only the wavelengths differ for each of the CELESTA sources. This paper focusses on the temporal characteristics of CELESTA light output, presenting typical data over different timescales and using a variety of photometric detectors.
Continuous Output Stability
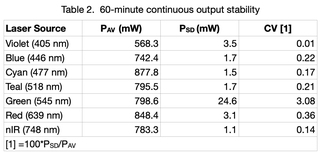
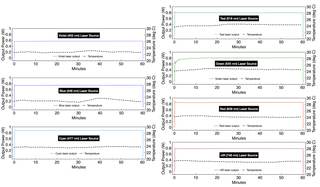
Output from each laser was directed through a 1.0 mm diameter multimode fiber (Lumencor p/n 10-10245) to a Coherent PM30 thermopile detector. Continuous output from each laser at 100% intensity was detected by the thermopile and digitized using a Coherent FieldMaxII-TO power meter and Coherent FieldMaxII software at 10 points per second for 60 minutes. Average power (PAV) and standard deviation (PSD) for n=36,000 measurements were calculated for each data set and are tabulated below. Light engine on/off control and intensity setting was controlled by the CELESTA control GUI. Temperature stability is a key prerequisite for stable laser output. Accordingly, the internal temperature of the light Engine recorded by the operating software was read once per minute during the test.
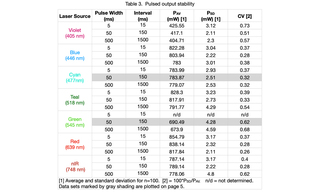
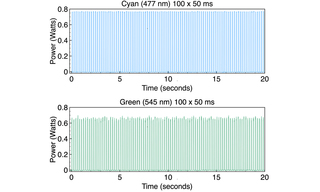
Pulsed Output Stability
Output from each laser source at 100% intensity was directed through a 1.0 mm diameter multimode fiber (Lumencor p/n 10-10245) to a Coherent PowerMax-Pro HP Sensor running in high-speed (20,000 s-1) detection mode. Output power versus time recordings were made for 100 pulses of three different pulse durations (5, 50 and 500 ms). Inter-pulse spacings were 15, 150 and 1500 ms respectively (25% duty cycle).Average (PAV) and standard deviation (PSD) output power for each 100 pulse sequence was calculated and are reported in Table 3.
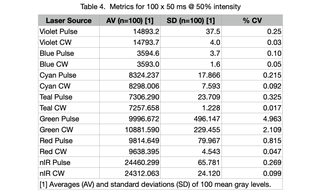
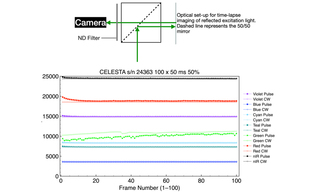
Time-lapse Imaging of Reflected Excitation Light
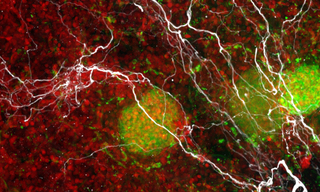
Light output from a CELESTA Light Engine was directed through a 1.0 mm multimode fiber (Lumencor p/n 10-10533) into the Ti2-LA-FLL epilluminator of a Nikon Ti2 microscope. Light was then directed to the sample plane via a 50/50 mirror and a Nikon Fluor 10X/0.5 NA objective. Back-reflected light from a plain glass microscope slide was collected by the objective, transmitted by the 50/50 mirror, attenuated by a neutral density filter and detected by a Hamamatsu ORCA-Fusion 2304 x 2304 px sCMOS camera. Time-lapse acquisition series of 100 frames at 50 ms exposure, 100 ms inter-frame spacing were acquired using MicroManager 1.4 control software for each laser line. Two different illumination modes were tested for each laser line. In continuous (CW) illumination mode, light output was turned on prior to initiation of the time lapse acquisition sequence and remained on for the duration of the sequence (~15 seconds). In pulse illumination mode, light output was turned on and off at the beginning and end, respectively, of each frame. The mean gray level for each frame was calculated using Image software and plotted below. The averages and standard deviations of 100 mean gray levels for each time lapse acquisition sequence are shown in Table 4. For all seven laser lines, CW mode produced small improvements in output stability as indicated by the coefficient of variance (CV) values in table 4.
Conclusions
In general, the three methods of laser stability testing described above produce self-consistent results. Methods 2 and 3 measure light output directly at the end of the optical fiber connected to the CELESTA’s output coupler. Method 4 measures light output after propagation from the end of the optical fiber through the microscope optical train to the camera. Method 4 is the most accessible methodology for most CELESTA users as it utilizes existing microscope infrastructure. The necessary optics (50/50 mirror and neutral density filter) are inexpensive and fit standard microscope filter cubes. The image acquisition and analysis software (MicroManager/ImageJ) is open source.
All seven lasers exhibit remarkably consistent dose stability. The areas under the curve for power as a function of time generated by all lasers, regardless of the pulse widths used herein, are less than 1% CV. Six of the seven lasers exhibit essentially the same temporal output stability characteristics. For experiments that require temporal stability, all colors except for the green (545 nm) laser will achieve stability within ~ 200 msec. For green, the temporal stability requires a suitable warm-up time, elimination of the first part of the waveform, and/or elimination of the first pulse. The unique behavior of green lasers is well known in the field, a characteristic of the materials from which they are fabricated. Its temporal behavior is manageable with respect to illumination in the microscopy techniques for which the CELESTA was designed, and referred to herein. This finding is independent of the method of measurement and time domain. Moreover, for fluorescence microscopy applications, the seven-laser array incorporated in the CELESTA provides some built-in redundancy. For example, the 518 nm line can be used as an alternative to 545 nm for fluorophores with emission in the 560–620 nm range. This substitution will provide greater temporal stability at the expense of slightly less efficient fluorescence excitation. In time-lapse acquisition mode using sCMOS camera detection (Method 4), all laser lines except for green provide output stability to better than 1% CV across 100 frames. For all lasers, this metric can be slightly improved by operating in continuous illumination mode. However, this improvement may come at the expense of increased photobleaching and phototoxicity (15 seconds of continuous illumination versus 5 seconds of intermittent illumination from 100 x 50 ms pulses in the case of the Method 4 tests).
Thoughtful and judicious experimental design is a foundation of good data collection and a requirement for any sophisticated protocol of the nature large data experiments demand. It’s a necessary element in the pursuit of reproducibility and consistency, and well-behaved laser illumination can support the discerning experimentalist in the pursuit of robust data when considered in the same vein.
Recommended Operating Conditions
- Continuous (CW) optical output up to at least 1 hour (Method 2)
- Discontinuous (pulsed) output maximum frequency 1 kHz (pulse width 0.5 ms)
- Pulsed output timing: TTL triggering from DAQ or camera is recommended for frame rates exceeding 10 fps
- Intensity control mode, pulsed operation: PID = OFF
- Intensity setting: 5–100%
- Linear optical power as a function of intensity setting
- Ambient temperature: 15—30°C maintained to +/- 2°C.
- Humidity: Dew point <10ºC with controlled ambient temperature <30º C.
- Free air circulation from front to back of the CELESTA
- HEPA air filtration for dust control
Recommended Applications
- High-throughput, widefield fluorescence microscopy e.g. optically pooled screening (OPS)
- Single-molecule localization microscopy e.g. MERFISH
- Structured illumination microscopy (SIM)
- Spinning-disk confocal microscopy
Contraindicated Applications
- Fluorescence correlation spectroscopy (FCS)
- Objective TIRF