White Paper: Solid-State Illumination for Multiplexed Fluorescence Detection
The capacity to simultaneously identify and localize multiple molecules or molecular assemblies in complex, heterogenous specimens has long been a primary attribute driving applications of fluorescence microscopy in the biological and physical sciences. For example, identification of the adenine, thymine, cytosine and guanine (ATCG) bases of DNA using four spectrally distinct fluorophors, has since 1986, been the basis of most automated DNA sequencing techniques [1]. However, genomic and transcriptomic investigations of large scale biological systems may require simultaneous identification and localization of hundreds and thousands of molecular targets. Such highly parallel analyses exceed the capabilities of spectral discrimination-based multiplexing. This article outlines the limitations of multiplexed fluorescence detection based on spectral discrimination and some of the techniques that have been introduced to expand the number of targets that can be interrogated.
Most multiplex detection schemes are based on spectral discrimination because it is less technically complex and less costly compared to methods based on temporal or spatial discrimination [2]. The scope of spectral discrimination methods is limited to about five targets due to spectral crosstalk, (Figures 1 and 2). This limitation is primarily due to the spectral characteristics of fluorescent dyes and fluorescent proteins (FPs) used for bimolecular labeling as illustrated in Figure 1. In this example, just two fluorescent labels’ excitation and emission wavelengths span the entirety of the visible wavelength range (400–700 nm), with significant spectral overlap, e.g. incomplete spectral separation. Similarly, there is little variation in spectral bandwidth for fluorescence excitation and emission among the many thousands of different dyes and FPs in current use.
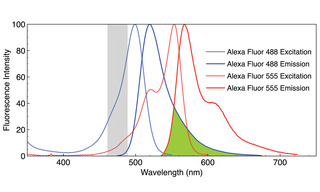
Figure 1. Normalized fluorescence excitation and emission spectra of Alexa Fluor 488 and Alexa Fluor 555 fluorophors. The region of emission spectral overlap is shaded in green. The region shaded in gray represents the excitation bandwidth (475/28 nm) used to acquire images A–C in Figure 2. Note that when both fluorophors are present, selective excitation of one and not the other is possible only at wavelengths greater than 550 nm.
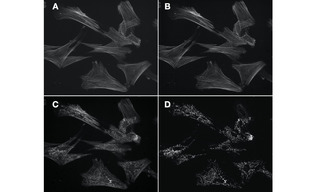
Figure 2. Figure 2. Four 60X fluorescence images of the same field of muntjac skin fibroblasts, labeled with Alexa Fluor 488 phalloidin (actin) and mouse anti–OxPhos Complex V + Alexa Fluor 555 goat anti–mouse IgG (mitochondria). A. Image of actin cytoskeleton acquired using single-band excitation and emission filters and a single band dichroic beamsplitter. B. Equivalent image of actin cytoskeleton acquired using single band excitation and emission filters and multi-band dichroic beamsplitter. C. Image of actin cytoskeleton degraded by detection of mitochondria due to spectral crosstalk. Image acquired using single band excitation filter, multi-band dichroic beamsplitter and multi-band emission filter. D. Image of mitochondria acquired using single band excitation filter, multi-band dichroic beamsplitter and multi-band emission filter. Image is not degraded by crosstalk because the excitation bandwidth (555/28 nm) does not intersect the excitation spectrum of Alexa Fluor 488 to a significant extent. Images acquired using a Lumencor SPECTRA Light Engine, Andor Zyla 5.5 sCMOS camera and Nikon Ti2 microscope.
Although quantum dot nanocrystals with narrow emission spectra have been developed [3], this improvement comes at the expense of more than an order-of-magnitude increase in fluorophor size compared to organic dyes, which in turn impedes their utility for bimolecular labeling applications [4].
With careful optimization of optical filters and secondary antibody labeling reagents, together with application of a robust unmixing algorithm that corrects raw fluorescence image data for crosstalk as well as nonspecific labeling, 10-fold multiplex imaging of brain tissue has been demonstrated [5]. The spectral output of a solid- state Light Engine optimized for selective excitation of the panel of fluorescent dyes used in this protocolis shown in Figure 3. The Light Engine incorporates LEDs, light pipes, and lasers to achieve the required distribution of spectral excitation and the needed optical power. The extent of multiplexing can be increased by successive rounds of stripping, relabeling and imaging, using the same fluorescent dye panel and filter configuration. With five cycles of stripping, 10-plex relabeling and imaging, simultaneous localization of 50 biomarker targets in whole rat brain coronal sections has been demonstrated [5].
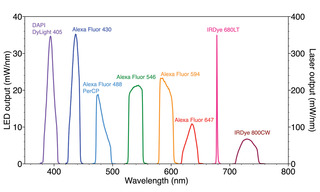
Figure 3. Spectral output of SPECTRA Light Engine optimized for selective excitation of fluorescent dyes used for 10-plex immunofluorescence detection [5].
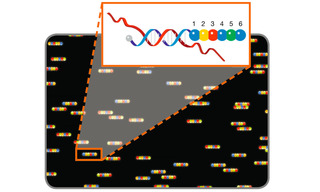
Multiplexing technologies capable of simultaneously identifying and localizing hundreds and thousands of biomolecular targets have been developed by adding spatial and temporal dimensions to spectral discrimination-based multiplexing [6]. To a considerable extent, these technologies make use of nucleic acid hybridization both for identifying DNA and RNA molecular targets and also as templates for producing sequential arrangements of fluorescent dyes. One such technology, molecular barcode scanning for gene expression analysis, was first described in 2008 [7]. Nucleic acid target sequences are detected by hybridization of oligonucleotide probes carrying linear sequences of six fluorescent dyes drawn from a four- color palette. A fluorescence scanner with excitation and emission filters tuned for discrimination of the four dyes, sequentially reads the fluorescence signal from probe positions one to six, revealing the coded identity of the target (Figure 4). To enable sequential reading from position one to six, the probes are immobilized and aligned in an applied electric field. At this scale, up to 4096 (46) molecular targets can be uniquely identified. More recently, this technology has been extended to provide spatially registered retrieval of molecular barcodes from tissue specimens [8].
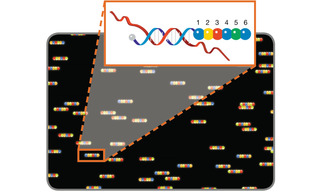
Figure 4. Molecular barcode scanning for gene expression analysis. A scanner with excitation and emission filters tuned for discrimination of 4 dyes represented by blue, green, yellow and red circles, reads the fluorescence signal from probe positions 1 to 6 to reveal the coded identity of the hybridized nucleic acid target.
MERFISH (multiplexed error-robust fluorescence in situ hybridization) is a massively multiplexed single- molecule imaging technology capable of simultaneously measuring the copy number and spatial distribution of hundreds to thousands of target RNA species in single cells [9,10,11]. In MERFISH, target-associated barcodes are read iteratively. First, encoding oligonucleotide probes are hybridized to target RNAs. Then fluorescent dye-labeled readout oligonucleotide probes are successively added, spatially localized at the single molecule level and then extinguished. Readout probes must hybridize exclusively to encoding probes, and not to cellular nucleic acids. The encoding probe identity is accumulated across successive imaging cycles, with binary bit value “1” assigned if the encoding probe is detected by hybridization of a readout probe, and a “0” value if it is not. In principal, 12 hybridization+imaging cycles would be required to identify 4095 (212-1) unique encoding probes. In practice, the binary coding space is underpopulated to minimize false negative (1>0) and false positive (0>1) calling errors and consequent misidentification of target RNAs. For example, identification of 10,050 RNA targets using a 69-bit barcode has been demonstrated [11]. The number of hybridization+ imaging cycles, and therefore the time required to complete data acquisition, can be reduced by simultaneous detection of readout probes with spectrally distinct fluorescent labels in each cycle (e.g. 23 imaging cycles x 3 fluorescent labels = 69 bits) [11]. MERFISH requires a high intensity, spatially uniform illumination field matched to the dimensions (~200 mm2) of typical sCMOS camera sensors. To meet this requirement, a specialized critical epilluminator coupled to the fiber output from a CELESTA laser Light Engine (Figure 5) is installed in the microscope, providing 1–10 W/mm2 at the sample plane via a high magnification objective with high numerical aperture.
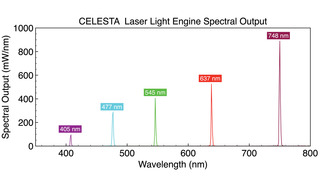
Figure 5. CELESTA laser Light Engine spectral output optimized for MERFISH multiplexed single- molecule imaging.
Clearly, highly parallel fluorescently labeled bioanalyses, those which demand multiplexing in excess of the capabilities of simple spectral discrimination, can be achieved using a judicious selection of fluors, optical filters, finely tuned excitation illumination and smart algorithms. Clever labeling strategies like molecular barcodes can also be employed on a vast variety of biological samples to enhance both spectral discrimination and spatial distribution of biomolecular information from highly complex tissue specimens. Herein, a massively parallel single-molecule imaging technique, MERFISH, is described, in which repetitive labeling protocols are exploited to maximize copy number and spatial distribution information for hundreds of thousands of RNA targets in single cells. The techniques and opportunities to retrieve voluminous data sets are critically important for today’s generation of genomic and transcriptomic information-rich bioanalyses. The experimentalist must spectrally parse a limited set of wavelengths to take best advantage of spectral breadth, spectral purity and fluorophor compatibility for optimal discrimination among excitation and emission. Strategic repetitive imaging, supported by pure, bright, stable illumination and high quality optical glass enable the most highly multiplexed results and overcome historical limitations defined within the available visible wavelengths.
- Jun 01, 2022
- [1] LM Smith, JZ Sanders, LE Hood et al., Fluorescence detection in automated DNA sequence analysis.(opens in new window)
- [2] R Datta, TM Heaster, MC Skala et al., Fluorescence lifetime imaging microscopy: fundamentals and advances in instrumentation, analysis, and applications.(opens in new window)
- [3] M Bruchez, M Moronne, AP Alivisatos et al., Semiconductor nanocrystals as fluorescent biological labels.(opens in new window)
- [4] P Le, R Vaidya, AM Smith et al., Optimizing quantum dot probe size for single-receptor imaging. (opens in new window)
- [5] D Maric, J Jahanipour, B Roysam et al., Whole-brain tissue mapping toolkit using large-scale highly multiplexed immunofluorescence imaging and deep neural networks.(opens in new window)
- [6] C Lin, R Jungmann, P Yin et al., Submicrometre geometrically encoded fluorescent barcodes self- assembled from DNA.(opens in new window)
- [7] GK Geiss, RE Bumgarner, K Dimitrov et al., Direct multiplexed measurement of gene expression with color- coded probe pairs.(opens in new window)
- [8] J Decalf, ML Albert, J Ziai, New tools for pathology: a user’s review of a highly multiplexed method for in situ analysis of protein and RNA expression in tissue.(opens in new window)
- [9] KH Chen, AN Boettiger, X Zhuang et al., Spatially resolved, highly multiplexed RNA profiling in single cells(opens in new window)