Fluorescence Microscopy: Single-Cell Immunization Responses
Single-cell Characterization of Immunization Responses
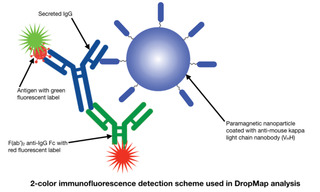
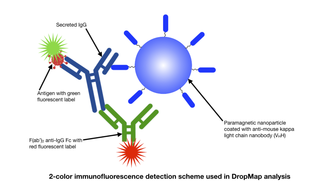
The current Covid-19 pandemic has sparked an urgent need for improvements in the characterization of the immune response to vaccinations. Although simple and robust, conventional antibody titer measurements provide little information on the phenotypic diversity of IgG-secreting cells (IgG-SCs), the functional properties of the antibodies they produce or the temporal profile of the immune reaction in response to an antigenic challenge. In a recent paper published in the Journal of Immunology (1) and other recent publications (2,3), a team of researchers based in Paris and Zurich describe the application of a single-cell analysis technique known as DropMap to provide quantitative analysis of the distribution of antibody secretion rates and affinities over the course of an immune response. The DropMap protocol begins with microfluidically controlled compartmentalization of single splenocytes, extracted from mice at time points up to 8 weeks after immunization, in individual 50-picoliter droplets together with immunomagnetic beads and fluorescently- labeled antigens and anti-IgG antibodies. The beads are magnetically aligned to form micrometer-sized structures that can be visualized by fluorescence microscopy using a SOLA Light Engine. Bead capture of red-fluorescent anti-IgG (Fc) identifies IgG-SCs, allowing determination of their frequency. Capture of green-fluorescent antigen provides information on antigen binding affinity. To accumulate population statistics, two-dimensional arrays containing >10,000 cell- containing droplets are imaged every 7.5 minutes over 37.5 minutes. The SOLA Light Engine provides microscopes with the exceptional light output stability required to extract reliable quantitative information across thousands of droplets and multiple time points.
- Oct 21, 2020