Parallel Light Engine Performance Monitoring Using the Onboard Control GUI
AURA, CELESTA, RETRA, SPECTRA, and ZIVA Light Engines incorporate a control GUI accessed through a web browser via an ethernet connection. Image acquisition applications used to control the Light Engine though connection of either the USB or RS232 serial ports can be run in parallel with ethernet-connected control GUI to aid in trouble-shooting. As shown in Figure 1, this allows the Light Engine to be controlled by the image acquisition software, while the GUI serves as a passive monitor of the Light Engine status.
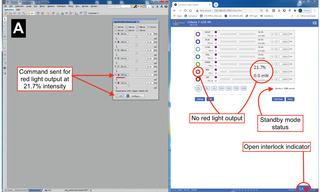
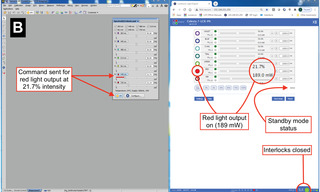
Figure 1. Screenshots of parallel operation of image acquisition software (NIS Elements, left) and CELESTA Light Engine Control GUI (right). A. NIS Elements command to turn on red light output at 21.7% is inoperative. Examination of the GUI display reveals that this is due to an open interlock condition (e.g. no optical fiber connected to the Light Engine output port). B. After closing the interlock, the same NIS Elements command results in light output, indicated by the filled red channel radio button and non-zero output power reading in the GUI.
The control GUI displays many types of information pertinent to the performance of the microscope Light Engine that are not accessible in current releases of most image acquisition software packages.
These include:
- Real-time light output power readouts
- Standby mode status
- Light Engine operating software error messages
- Humidity/dew point data
- Serial port configuration
- TTL port configuration
- Cumulative run time data
In cases where the PC being used for image acquisition control has a single ethernet port that is dedicated to internet access, a USB-to-ethernet adapter (Figure 2) can be used for connection to the Light Engine control GUI. USB-to-ethernet adapters are readily available from online vendors for less than $20.
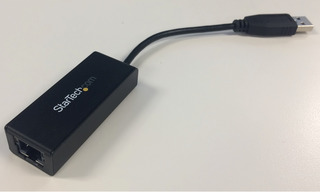
Figure 2. USB-to-ethernet adapter
- Oct 28, 2020