Spectral, Spatial, and Temporal Output Characteristics of Light Sources for Optogenetic Stimulation
Lumencor provides spectrally and spatially resolved data of the functional complexity of neural networks, while avoiding direct physical interrogation using historically ubiquitous microelectrodes. Optogenetics addresses cells and cellular function using non-destructive illumination, rather than invasive electrodes. ‘Genetics’ refers to transgenic expression of photoactivatable ion channel proteins, required to transduce light input into electrical activity in the cells of interest.
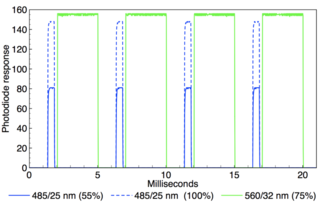
Figure 1: Oscilloscope recording of alternating 485nm (0.5ms width) and 560nm (3 ms width) output pulses generated by TTL triggering of a AURA, SPECTRA, and SPECTRA X Light Engine. Two superimposed oscilloscope traces are shown in which the 485nm intensity is adjusted from 100 to 55 per cent via RS232 serial commands while the 560nm intensity remains constant. Temporal separation of the 485 and 560nm pulses is ~0.25ms.
Microscope illumination sources used for optogenetic stimulation must meet certain requirements in terms of spectral, spatial, and temporal output characteristics. This article considers these characteristics in relation to the performance of solid-state LED- and laser-based Light Engines.
The primary spectral output requirement is maximal intersection of the Light Engine spectral output with the action spectra of photoactivatable ion channel proteins. Currently, the most commonly used spectral outputs are 475nm for stimulation with channelrhodopsin (ChR2) and 575nm for inhibition with halorhodopsin (NpHR). LED-based Light Engines provide spectral outputs that are temporally discrete (figure 1) but spatially coincident. Additional spectral outputs facilitate use of novel photoproteins, and provide for excitation for fluorescent markers and voltage sensitive dyes, in parallel with optogenetic stimulation or inhibition.
For example, deeper tissue penetration can be attained by using near-infrared (>700nm) light for optogenetic stimulation. It is common practice to use co-expression of yellow fluorescent protein (YFP) to enable localization of ChR2 by fluorescence microscopy. The choice of YFP is dictated by the fact that its fluorescence excitation (510nm) is sufficiently wavelength-separated from photo stimulation of ChR2 (475nm) that the two processes can be independently initiated.
For in vitro experimentation on brain slice or cultured neuron preparations, LED-based Light Engines coupled to fluorescence microscopes provide wide-field illumination suitable for simultaneous stimulation of thousands of neurons. For stimulation of ChR2, an irradiance threshold of ~1mW/mm2 at the sample plane is required, a level which is towards the lower end of the range used for conventional fluorescence microscopy. Spatially selective illumination can be generated by addition of a digital micro-mirror device (DMD).
For selective stimulation of individual cells, laser light sources that can be focused to diffraction limited spot sizes <10µm are required. In vivo experiments provide the added capacity to observe complex behavioral outcomes elicited by optogenetic stimulation. Light is typically delivered through a 200µm diameter multimode optical fibre, connected to a cannula implanted in the brain of an animal subject. Lasers provide better coupling efficiency into these optical fibres than LEDs, and are therefore the preferred light sources for in vivo optogenetics.
The electrical activity of neurons is modulated on the millisecond timescale. Therefore, illumination sources used for optogenetic stimulation must have the capacity for optical modulation on the same timescale (figure 1). A publication by Kubota and co-workers takes full advantage of the temporal and output power control provided by the AURA, SPECTRA, and SPECTRA X Light Engine to characterize photo-stimulation of ChR2-expressing rat dorsal root ganglion (DRG) neurons. Effects of varying light pulse durations (0.1 to 10ms) at constant intensity and varying stimulation intensities (2 to 78mW) at constant pulse width were recorded.
In addition, stimulation by pairs of 0.5ms pulses separated by varying intervals from 5 to 20ms was used to assess the effects of ChR2 desensitization. Quantitative comparisons of optogenetic and conventional electrical stimulation are included, providing a useful point of reference for readers previously unacquainted with the capabilities of optogenetic techniques.
- Mar 30, 2021